15-Nov-2017
How We Can Measure Server Performance Using JMeter?
By Raghav Vashishth
15-Nov-2017
By Raghav Vashishth
Performance Testing works as the process of measuring a system’s performance by increasing the demand on the system. It is performed to ascertain a system's behavior under normal as well as the estimated peak load conditions.
JMeter is a segment of the Apache Open-Source project. It is an application that can be used to perform functional testing and load testing. It is designed as a pure Java application and can be used to perform load testing of any type of web application including the ones written in .NET, PHP, etc.
With the help of JMeter, multiple threads can be created, timers can be set up for testing, and assertions and listeners can be set for the test plan. A test plan enables the user to set the test configuration that is specific to an application. After right-clicking the ‘Test Plan’ item, the menu is revealed. In the menu, on hover over the ‘Add’ item user can see various test features that can be created for a test plan. After the creation of the test features, these are executed by the tester.
With years of experience providing performance testing services to business organizations from diverse niche, this blog will help you understand the benefits JMeter dissipates for performance testing while sharing a quick guide on measuring server performance using JMeter.
Let’s begin!
Wondering How Continuous Performance Testing Works?
Read Here: Continuous Performance Testing: Understanding The Best Practices
JMeter consists of many listeners that provide useful information like the response time of each request, the number of requests being processed, response data, throughput, error percentage, etc. but actually there is a strong need to know the utilization of server system resources, like CPU/Memory utilization.
If JMeter tests are run against software running on a computer or server, the chances are that the user will manually match the JMeter results with statistics of CPU or Memory Usage from the server. This process can be made a lot easier by using ‘PerfMon Metrics Collector’ which is basically a listener.
Below is the graphical view of server resource utilization parameters.
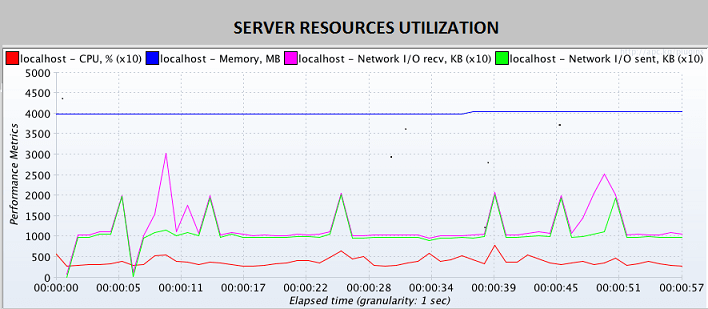
Server Resources Utilisation
There is a plugin called ‘PerfMon’ available in JMeter Plugins which provides a way to collect the performance metrics of your server’s health. The ServerAgent is available for collecting the server performance metrics, and one JMeter plugin that provides us with a visual report of the same.
The ServerAgent by default opens port 4444 and starts a thread to listen to all the data present on the server machine. It also allows the external system to read the listener data and the JMeter plugin ‘jp@gc – PerfMon Metrics Collector’ can listen to the ServerAgent on the server. Users can start the PerfMon Agent by opening the ‘startAgent.bat’ file and the user is supposed to run this on all servers from where he/she is interested to collect the data.
As the PerfMon Agent runs, the user is allowed to collect the data using the PerfMon Metrics Collector plugin. Moving further, to create the lines on the graph ‘Add Row’ can be used using a row per metric. ‘Row’ tab can be used by the user to filter the collected data if he/she just wants to see the CPU data on its own.
i) CPU
ii) Memory
iii) Swap
iv) Disks I/O
v) Network I/O
vi) TCP
Now when the user is all set up, here are the steps to view the system’s health:
1. User needs to go to the Application Under Test.
2. Select the “Performance” tab from the Task Manager.
3. Choose the “Ethernet” view.
4. In JMeter, the user needs to add the PerfMon Metrics Collector Listener and must provide the machine’s IP address that has the test application, the port the PerfMon Server Agent is listening to, and the “interested” metric that the user needs to see.
5. Now the test can be started and the user can take a look at the charts on the left and the right.
6. In this way, the user can monitor severalPerfMon metrics, including CPU, Memory, Disk I/O, Network I/O, and JMX.
To conclude, performance testing is an extremely crucial part of the overall Quality Assurance process. It not only helps to create technology that performs smoothly for every load condition but even complements the scalability and sustainability goals of an application or software.
Performance testing works as an extremely vital process for identifying the maximum operating capacity of any digital product. More importantly, performance and load testing allows launching robust solutions that are more future-proof.
And just in case you are having trouble aligning the long-term objectives of your system server or enterprise software, feel free to reach our team through info@bugraptors.com
Raghav Vashishth
Raghav is a QA enthusiast working as a Team Lead at BugRaptors. He has diverse exposure in various projects and application testing with a comprehensive understanding of all aspects of SDLC. He has 7 plus years of hands-on experience with blue-chip companies like Hitachi, Vmware, and Kloves. He is well versed in Load and Performance testing, API Testing, Manual testing, Mobile application testing, Web application testing and can create effective documentation related to testing such as Test Plan, Test Cases, Test Reports, etc.
Interested to share your
Read More
BugRaptors is one of the best software testing companies headquartered in India and the US, which is committed to catering to the diverse QA needs of any business. We are one of the fastest-growing QA companies; striving to deliver technology-oriented QA services, worldwide. BugRaptors is a team of 200+ ISTQB-certified testers, along with ISO 9001:2018 and ISO 27001 certifications.

Corporate Office - USA
5858 Horton Street, Suite 101, Emeryville, CA 94608, United States
 +1
(510) 371-9104
+1
(510) 371-9104

Test Labs - India
2nd Floor, C-136, Industrial Area, Phase - 8, Mohali -160071, Punjab, India
+91 77173-00289
Corporate Office - India
52, First Floor, Sec-71, Mohali, PB 160071,India

United Kingdom
97 Hackney Rd London E2 8ET

Australia
Suite 4004, 11 Hassal St Parramatta NSW 2150